Fish Stocking
Community hatcheries stock millions of fish each year to help rehabilitate native species populations and to maintain or enhance angling opportunities through put-grow-take fish stockings. Fish are stocked at different development life stages depending on the species and the fish stocking objectives. Community hatcheries work in cooperation with the Ontario Ministry of Natural Resources and Forestry to establish stocking targets/plans (i.e. species, egg source, stocking numbers, and developmental life stage at stocking) that are in-line with fisheries management plans and/or community fisheries objectives. See table below for more information on the different species that CHP supported community hatcheries reared and stocked into public waters.
Since 2013, CHP supported community hatcheries have
stocked 76,387,747
fish into Ontario lakes and rivers.
Click the icon beside each fish below for more information on that species.
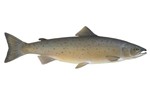
Atlantic Salmon ( 546,942 )
| Year | Stocking Totals |
|---|---|
| 2023 | 22,719 |
| 2022 | 34,984 |
| 2021 | 31,725 |
| 2020 | 47,931 |
| 2019 | 43,570 |
| 2018 | 52,632 |
| 2017 | 59,491 |
| 2016 | 34,890 |
| 2015 | 71,441 |
| 2014 | 50,970 |
| 2013 | 96,589 |
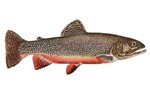
Brook Trout ( 202,750 )
| Year | Stocking Totals |
|---|---|
| 2023 | 19,277 |
| 2022 | 11,661 |
| 2021 | 19,753 |
| 2020 | 12,467 |
| 2019 | 10,206 |
| 2018 | 35,894 |
| 2017 | 17,486 |
| 2016 | 9,849 |
| 2015 | 24,254 |
| 2014 | 27,223 |
| 2013 | 14,680 |
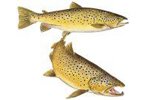
Brown Trout ( 2,007,047 )
| Year | Stocking Totals |
|---|---|
| 2023 | 158,360 |
| 2022 | 177,590 |
| 2021 | 191,301 |
| 2020 | 117,366 |
| 2019 | 185,062 |
| 2018 | 148,201 |
| 2017 | 198,751 |
| 2016 | 161,392 |
| 2015 | 182,903 |
| 2014 | 199,153 |
| 2013 | 286,968 |
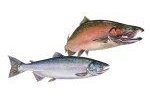
Chinook Salmon ( 3,333,503 )
| Year | Stocking Totals |
|---|---|
| 2023 | 330,185 |
| 2022 | 210,707 |
| 2021 | 283,259 |
| 2020 | 253,818 |
| 2019 | 342,767 |
| 2018 | 336,771 |
| 2017 | 243,599 |
| 2016 | 402,402 |
| 2015 | 233,932 |
| 2014 | 464,376 |
| 2013 | 231,687 |
Coho Salmon ( 420,590 )
| Year | Stocking Totals |
|---|---|
| 2023-2021 | 0 |
| 2020 | 96,000 |
| 2019 | 40,000 |
| 2018 | 40,000 |
| 2017 | 40,110 |
| 2016 | 45,056 |
| 2015 | 44,264 |
| 2014 | 56,460 |
| 2013 | 58,700 |
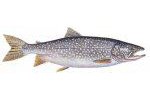
Lake Trout ( 197,058 )
| Year | Stocking Totals |
|---|---|
| 2023 | 12,716 |
| 2022 | 15,275 |
| 2021 | 9,755 |
| 2020 | 16,252 |
| 2019 | 11,686 |
| 2018 | 15,421 |
| 2017 | 22,139 |
| 2016 | 17,555 |
| 2015 | 11,000 |
| 2014 | 24,655 |
| 2013 | 40,604 |
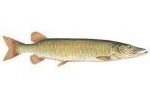
Muskellunge ( 10,048 )
| Year | Stocking Totals |
|---|---|
| 2023-2019 | 0 |
| 2018 | 1,682 |
| 2017 | 1,197 |
| 2016 | 579 |
| 2015 | 4,200 |
| 2014 | 2,254 |
| 2013 | 136 |
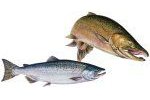
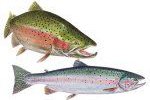
Rainbow Trout ( 4,174,886 )
| Year | Stocking Totals |
|---|---|
| 2023 | 321,149 |
| 2022 | 282,148 |
| 2021 | 161,768 |
| 2020** | 300,013 |
| 2019 | 372,619 |
| 2018 | 381,799 |
| 2017 | 438,299 |
| 2016 | 468,837 |
| 2015 | 415,679 |
| 2014 | 471,200 |
| 2013 | 570,375 |
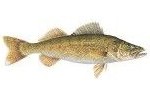
Walleye ( 65,494,923 )
| Year | Stocking Totals |
|---|---|
| 2023 | 7,327,057 |
| 2022 | 7,527,249 |
| 2021 | 4,852,433 |
| 2020** | 0 |
| 2019 | 6,950,688 |
| 2018 | 4,537,446 |
| 2017 | 5,722,655 |
| 2016 | 4,719,550 |
| 2015 | 3,195,398 |
| 2014 | 8,302,493 |
| 2013 | 12,359,954 |
** ALL Walleye and some Rainbow Trout community hatcheries could not operate in 2020 due to COVID-19 restrictions during the egg collection timeframe and some community hatcheries remained closed in 2021 due to ongoing volunteer safety concerns.
Matt Burley
Community Hatchery Program Coordinator
Ontario Federation of Anglers and Hunters
PO Box 2800
4601 Guthrie Drive
Peterborough, ON K9J 8L5
Phone: 705-748-6324 Ext. 247
Fax: 705-748-9577
E-mail: matt_burley@ofah.org
Want to volunteer?
Use the map below to locate a hatchery near you (click on the fish icon for hatchery details)
Note: These are just relative locations of each hatchery. To obtain actual locations please contact community hatcheries directly.
If the contact information is incomplete for any hatchery that you would like to contact, please contact the Community Hatchery Program Coordinator.
